_fbeta AbEM-Dashboard for DiGA
Background
At the beginning of 2026, the German government introduced application-accompanying performance measurement (anwendungsbegleitende Erfolgsmessung; AbEM) for all DiGA which are permanently listed in the BfArM DiGA registry (https://diga.bfarm.de/de).
The aim of this measure is to use real-world data on how patients use DiGA to increase transparency around treatment outcomes and to encourage competition based on the quality of the treatment options that DiGA provide.
One consequence of this measure is that, starting in July 2026, DiGA manufacturers are required to begin collecting data on DiGA usage. Insights for each two-quarter period must be reported to the Federal Institute for Drugs and Medical Devices (BfArM), with the first report due in April 2027. DiGA usage and outcome metrics will also affect prescription prices: at least 20% of the prescription cost must depend on the DiGA’s measured success. For this AbEM figures must be reported to GKV-SV, too.
How does BfArM measurement usage and success?
AbEM will be introduced in different phases, with the first phase focussing on measurements of usage patterns and adherence. Later phases will then add questionnaires asking for patient experience and reported outcomes.
The categories below describe the data that must be derived from patients’ DiGA usage for the first AbEM phase. For most numeric metrics, manufacturers must also calculate summary statistics such as mean, minimum, maximum, standard deviation, and the 25th and 75th percentiles.
The term “usage week” refers to the number of weeks that have passed since an individual patient’s prescription start
Cancellations
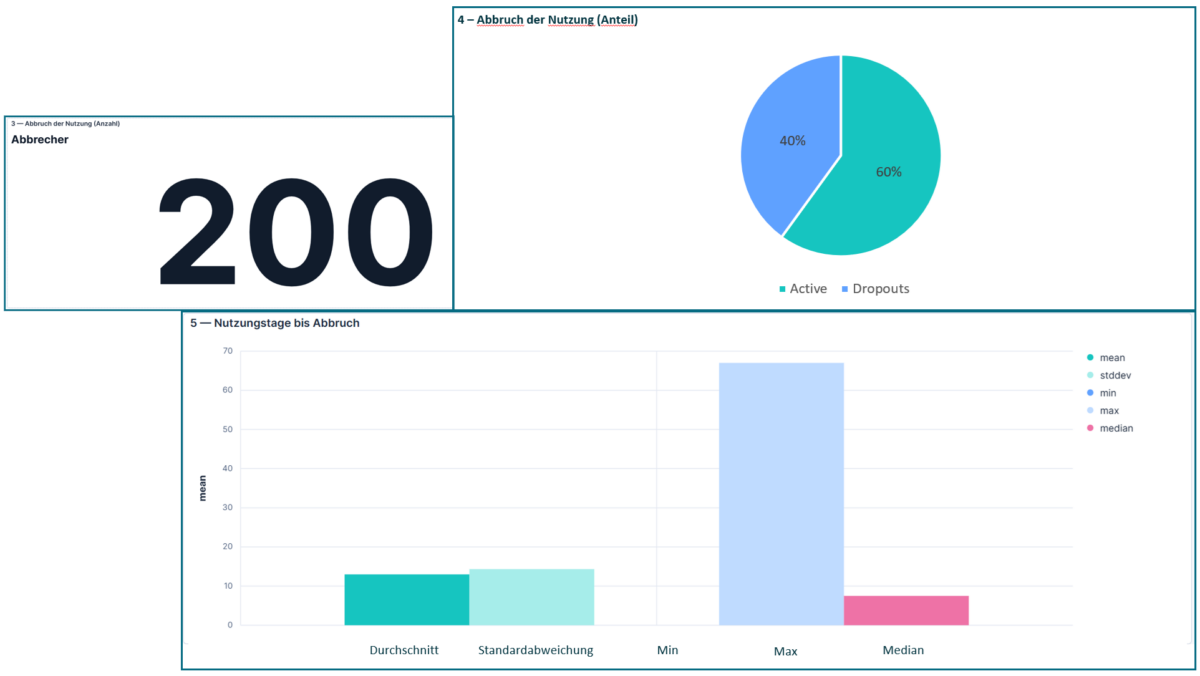
Cancellations are patients who cancel or abandon treatment prematurely (defined as 21 days without usage).
Required metrics:
- Absolute number of users
- Percentage of users who ended their treatment prematurely compared to the total number of users
- Number of usage days (including summary statistics such as mean, minimum, maximum, etc.)
Success
Success refers to adherence as the number of patients who use the DiGA until the end of the prescription period.
Required metrics:
- Absolute number of users
- Percentage of users who successfully completed treatment compared to the total number of users
Usage
Usage must be calculated both:
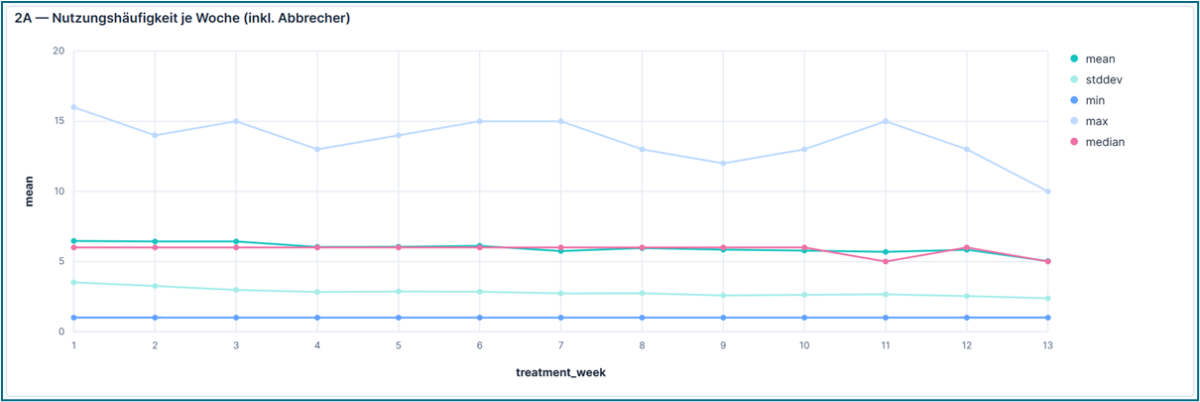
- including users who ended their treatment prematurely, and
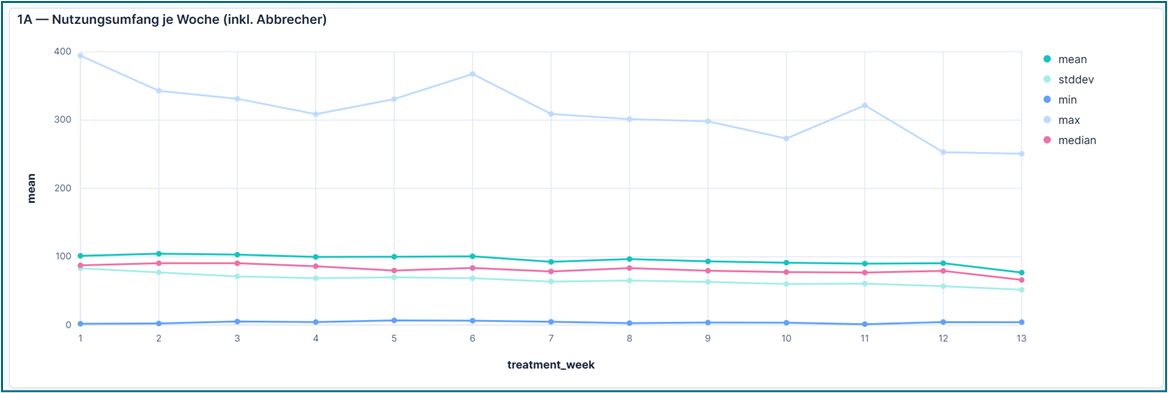
- excluding users who ended their treatment prematurely.
Required metrics:
- Average number of usage sessions per patient per usage week
- Average DiGA usage time (minutes) per patient per usage week
Implications for DiGA manufacturers
To compute these insights and deliver them to BfArM, DiGA manufacturers should promptly implement functionality to collect usage data from their applications, to ensure they have the data required for proper analytics, and then design a solution that actually calculates the analytics required to be reported to BfArM and GKV-SV.
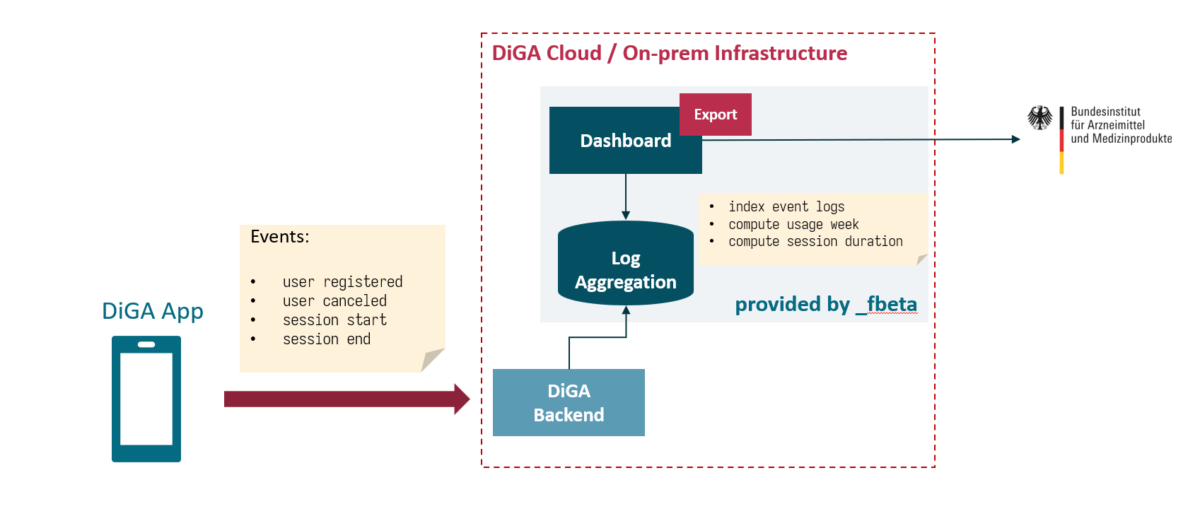
From a technical perspective, the data collection can be achieved by aggregating event logs for user registrations, logins, and application starts and shutdowns.
CAVE: The logs usually written by a DiGA are not sufficent for calculating the requested AbEM statistics. In addition, these logs must be deleted after 3 month latest. Therefore we strongly recommend to run a dedicated log solely for the prupose of AbEM data processing.
How fbeta supports this process
To support DiGA manufacturers through this process, fbeta has developed an event log database with an analytics dashboard that provides the following functionality:
- An event log database with an API for registering all event types, that are required for calculating prescriptions, cancellations, and usage of DiGA
- A visual dashboard, daily updated with the newest AbEM statistics and analytics
- Functionality for creation of AbEM reports, ready to be transferred to BfArM and GKV-SV (will be provided as an update as soon as BfArM publishes the respective interfaces).